Sample data
Here are examples of plots of some of the data that are available on the Fleetlink server. Gaps in the data indicate time periods when the sensors were not available or turned on. Click on the images to see larger versions.
To create plots, select the dataset of interest or choose 'Next' button at the top to expand the entire selection (after choosing an initial dataset).
Then click on 'Plotting and Other Operations' and choose 'Simple X-Y plot'; select the variables to plot; select 'Make the Plot'.
OR
Download the data to your computer: click on 'Plotting and Other Operations' and choose from the options under 'Listing and downloading data'. Then plot using your favorite software. The examples below were plotted with Matlab.Instructions on how to access data and do simple on-line plotting.
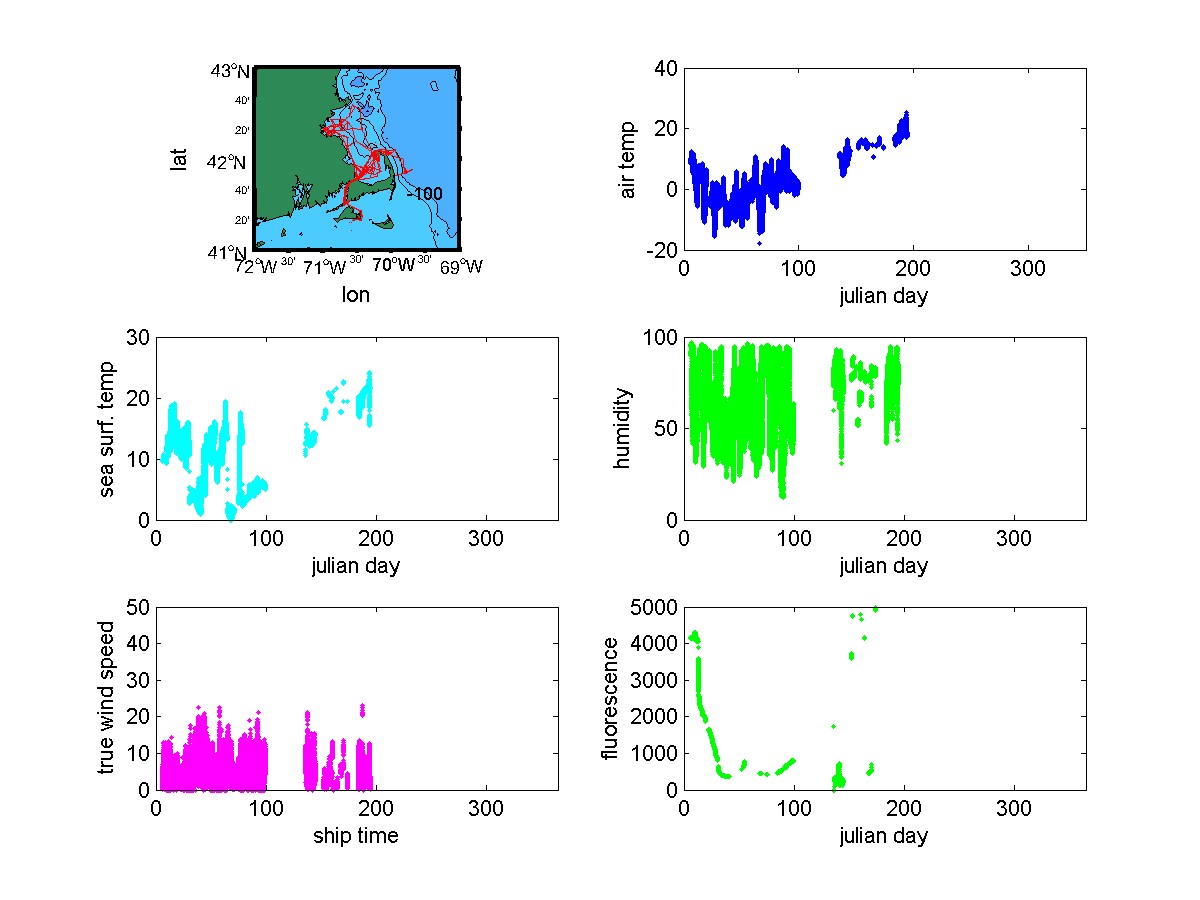
 TV/Tioga - 2007 (click image to enlarge)
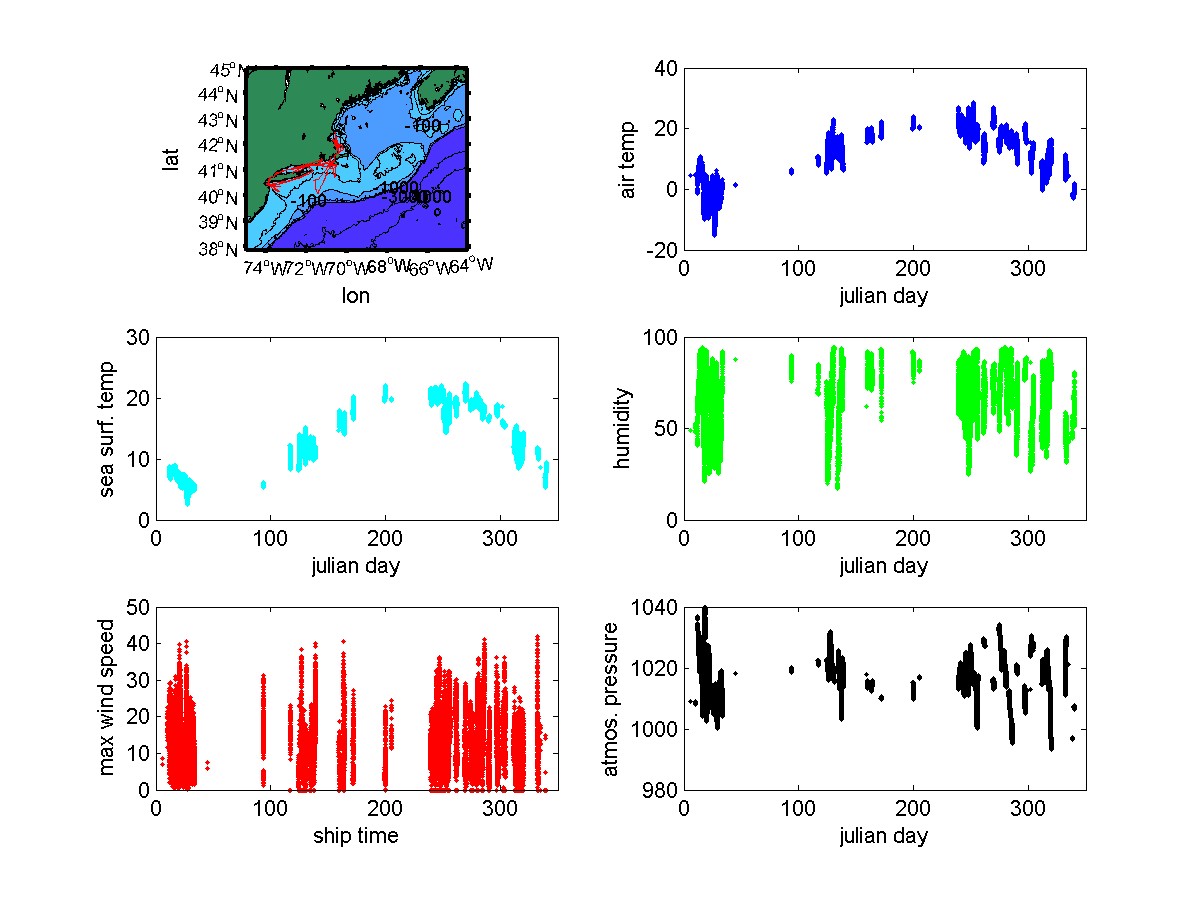
 RV/Connecticut - 2007 (click image to enlarge)
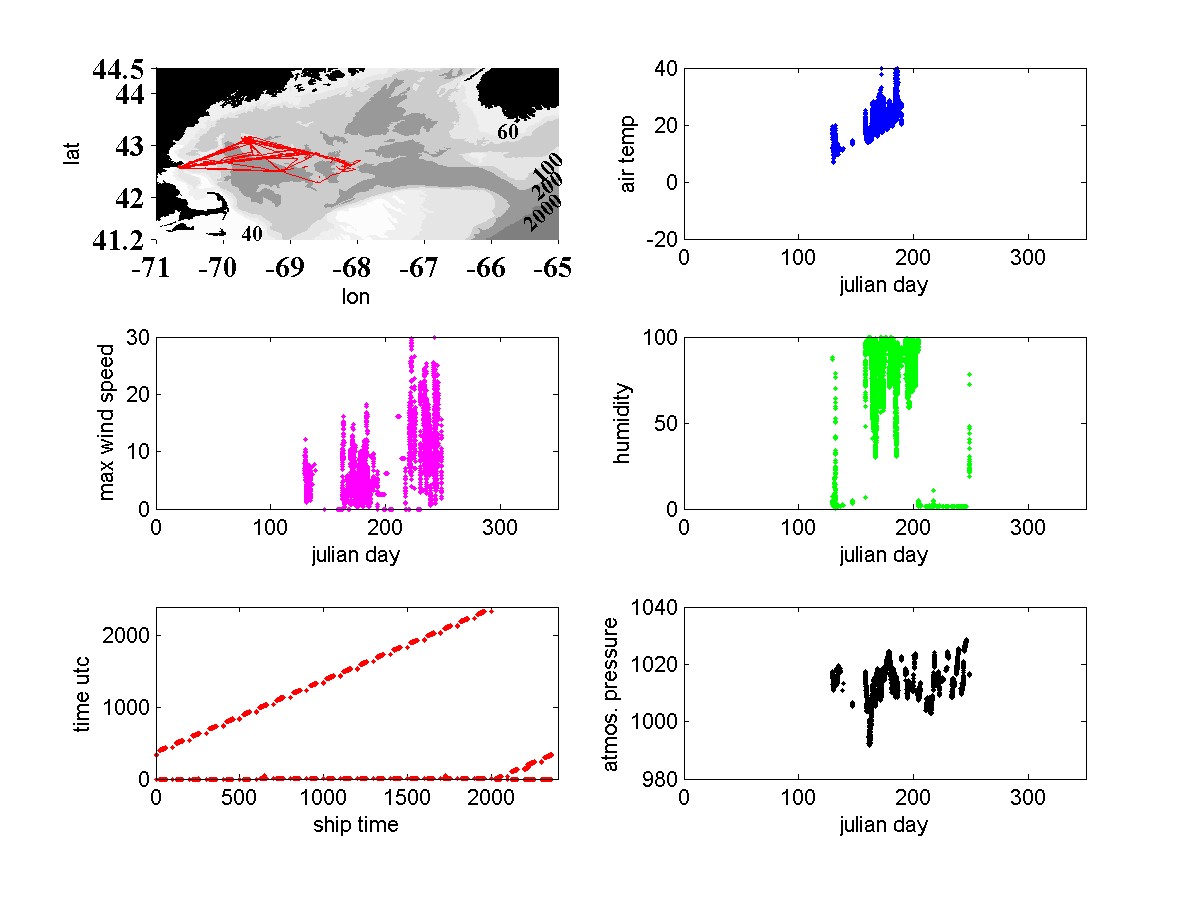 Fishing Vessel - 2006 (click image to enlarge)

 RV/Gulf Challenger - 2005 (click image to enlarge)
